Carbon footprint

Oikia is a domestic and responsible snack

We want to make it easier for consumers to make informed choices, so we have added a label indicating the product’s carbon footprint to our consumer packaging. The label expresses the carbon footprint in carbon dioxide equivalents per 100 grams of the finished product (g CO2e/100 g).

How are the carbon footprints calculated and what do they consist of?

The carbon footprints of Oikia products have been calculated using Biocode’s product-specific carbon footprint calculator. The calculation methods are based on ISO standards for life cycle assessment and carbon footprint calculation, GHG Protocol guidelines, IPCC reports, and generally applied life cycle assessment calculation methods. The calculation takes into account greenhouse gases (carbon dioxide, methane, and nitrous oxide) and expresses their impact in carbon dioxide equivalents. The calculation considers emissions throughout the product’s lifecycle from cradle to factory gate.

In practice, the calculation includes emissions from raw material production, transportation of raw materials, processing of products into final products, and emissions from packaging materials. The current figures on the packaging are based on 2021 production data.

The majority of the carbon footprint of Oikia products comes from raw material emissions during their initial production, averaging 52%. Packaging materials contribute an average of 28% of emissions, and our own production accounts for an average of 18%. Transportation of raw materials and packaging materials to the factory contributes only a small amount, averaging 2% of total emissions.
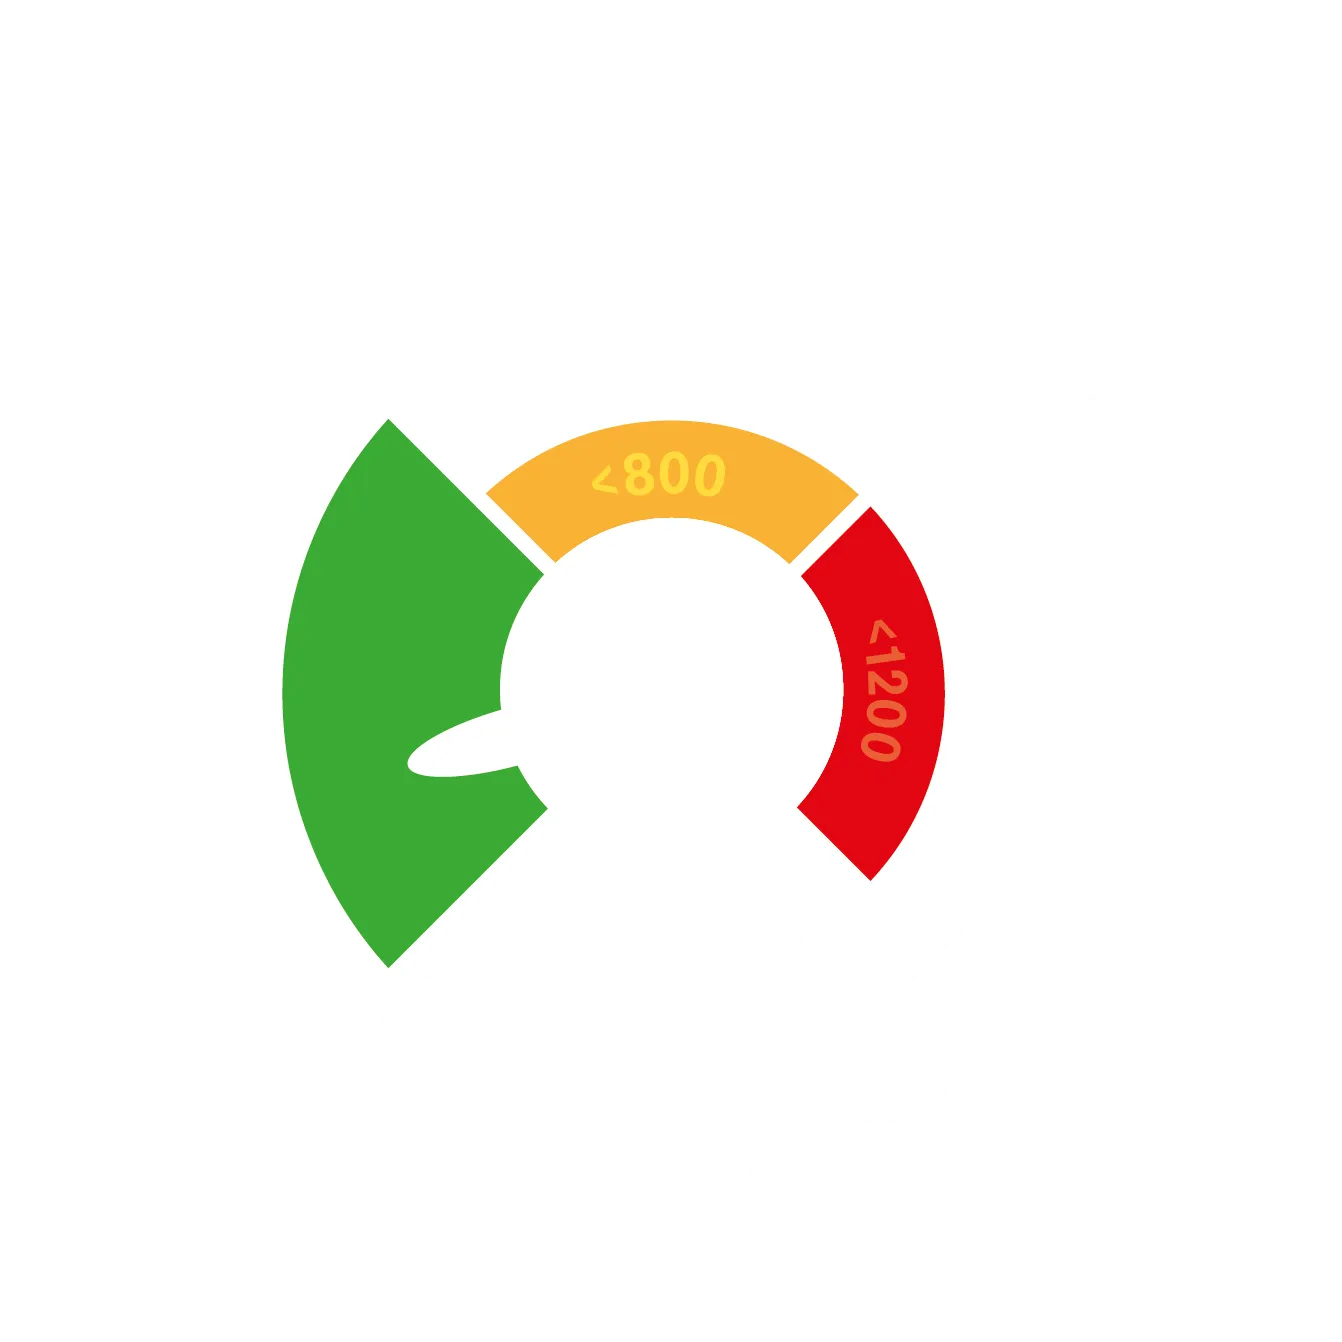
The carbon footprints of Oikia products are small compared to the category averages.

The calculation results should primarily be compared to the results of similar products within their own product category. Biocode’s benchmark classification, based on the average carbon footprints of the respective product category, can be used as a reference. The class limits in the chips and snacks category are: Class A max 250 g CO2e/100 g, Class B max 320 g CO2e/100 g, Class C max 400 g CO2e/100 g, Class D max 470 g CO2e/100 g. Thus, Class A has the smallest carbon footprint and Class D the largest.

When comparing Oikia products to the chips and snacks category, most of them fall into Class A:

Carbon footprint, g CO2e/100 g Benchmark-class
salted potato chips, small bags 200 A
salted potato chips, large bags 180 A
flavoured potato chips, small bags 210 A
flavoured potato chips, large bags 185 A
oat chips 180 A
organic corn snacks 320 B
organic oat snacks 320 B

The carbon footprint of Oikia products is reduced by several factors, including the use of a blend of European sunflower and rapeseed oil instead of palm oil, which is sourced from further away. We use domestic potatoes and oats, resulting in shorter transportation distances. Additionally, the primary energy source for our factory is steam produced from wood chips, which is renewable energy. The packaging size also affects the carbon footprint, with larger packages generally having a smaller footprint per 100 grams of product. This is because the proportion of packaging material is smaller relative to the content.

How reliable are the carbon footprints of Oikia products?

The calculations have been made in collaboration with Biocode’s experts, so they have been verified by an external specialist. Calculating the carbon footprint is an assessment and always includes some assumptions. Additionally, different boundaries can affect the final result. However, the starting point is that the calculations are always based on the best available information. The methods for life cycle assessment of products are continuously evolving, and we aim to closely follow industry practices.

We update our calculations annually and simultaneously review the quality of the available data and the validity of the calculation method. We update the figures on product packaging along with other packaging material updates.

What can consumers do to snack in a climate-smart way?

The carbon footprint we calculate covers emissions up to the factory gate. However, emissions are also generated later in the product’s lifecycle: from transportation to the store, as well as in the store and at the consumer’s home. As a consumer, you can reduce emissions by managing waste.

Disposing of the packaging also generates emissions. Place the empty package in either cardboard or plastic recycling according to the packaging’s recycling instructions. This ensures that valuable materials are recycled.

We strive for continuous improvement

Through calculation, we monitor the emissions of our products annually. We develop our products and manufacturing processes to reduce the carbon footprints of our products. We actively seek new raw materials and packaging materials with a low carbon footprint and develop our operations towards more emission-free solutions. Fodelia Retail Oy’s goal is to be carbon neutral by 2035. You can learn more about the entire Fodelia Group’s sustainability efforts here.